Summary Avg. Daily Temperatures
Jose V. Die
March 1, 2016
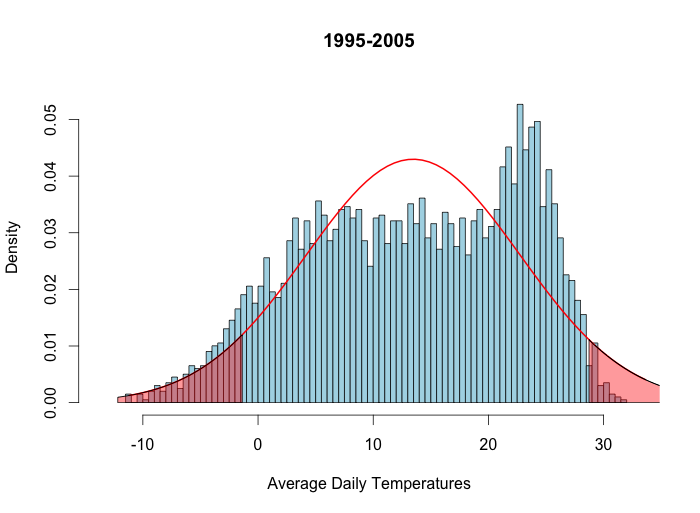
Average Daily Temperatures in Beltsville (MD). Data set 1.
Temperatures are shown in ºC.

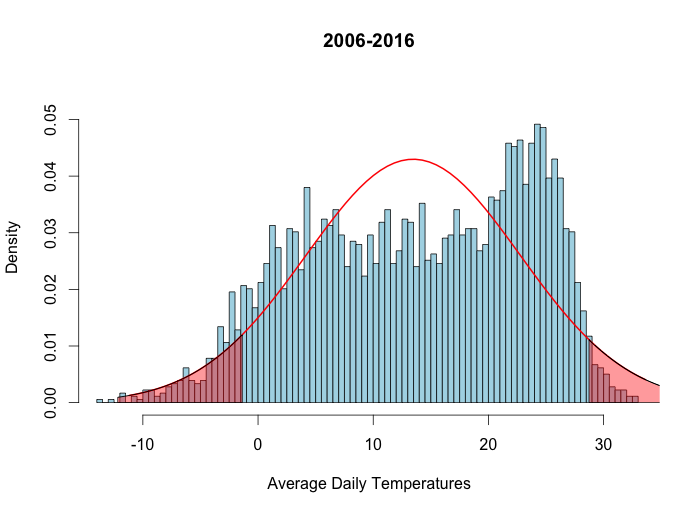
Data are approximately normal distributed.

- Mean temperature (1995-2005) = 13.46ºC
- 48 days with higher tmeperatures above the 95th percentile.
- 247 days with lower temperatures below the 5th percentile.

Average Daily Temperatures in Beltsville (MD). Data set 2.

- Mean temperature (2006-2016) = 13.87ºC
- 83 days with higher tmeperatures above the 95th percentile.
- 325 days with lower temperatures below the 5th percentile.